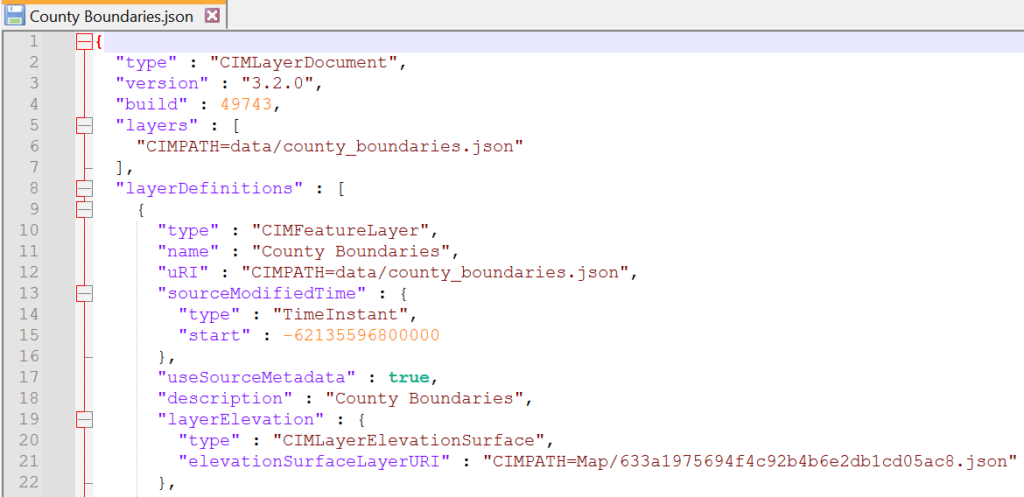
The Cartographic Information Model (CIM) is a map content specification for cartographic descriptions of GIS datasets and Project components in ArcGIS Pro. Essentially, it is the JSON that represents specifications for maps, scenes, layouts, layers, symbols, and styles in ArcGIS Pro. The best way to view these JSON specification is to save an element to a .*x file format such as .lyrx or .mapx, and then open the file in a viewer such as Notepad or Notepad++. It is necessary to open these files and get an understanding of the structure of the JSON in these files in order to understand how you access and update the properties for an element, such as the symbology for a layer. You can change the .lyrx to .json if your viewer has syntax highlighting for JSON like the example below using Notepad++
If you are interested in learning ArcPy, check out this course!
Here is the documentation for CIM namespaces.
How to access the CIM for a Layer with ArcPy
We can use a layer objects getDefinition() function to return a CIM definition. We need to supply the cim_version as a parameter to the getDefinition() function. For ArcGIS Pro 2.x we use “V2” and “V3” for ArcGIS Pro 3.x. The example for this blog post relate to ArcGIS Pro 3.2. The below code snippet returns the CIM definition for a layer called County Boundaries using the Python window in an APRX.
aprx = arcpy.mp.ArcGISProject("CURRENT")

## access a Map using listMaps to return a list of map objects
## index 0 returns the first map object returned in the list.
m = aprx.listMaps("Map")[0]

## access a layer using listLayers to return a list of layer objects
## index 0 returns the first layer object returned in the list
lyr = m.listLayers("County Boundaries")[0]

## use getDefinition to get the CIM
lyr_cim = lyr.getDefinition("V3")
Where in the CIM definition is the symbology?
If we take a look at the JSON, the symbology is in the renderer property. Within the renderer we have a property called symbol, which also has a property called symbol, and this nested symbol property has a property called symbolLayers whose value is a list of elements that make up the symbology for the County Boundaries polygon layer; CIMSolidStroke represents the polygon boundary, and CIMSolidFill represents the polygon fill.
TIP: Manually alter the symbology in ArcGIS Pro save as a .lyrx file and open as JSON to see how all sorts of symbology are represented.
"renderer" : {
        "type" : "CIMSimpleRenderer",
        "sampleSize" : 10000,
        "patch" : "Default",
        "symbol" : {
          "type" : "CIMSymbolReference",
          "symbol" : {
            "type" : "CIMPolygonSymbol",
            "symbolLayers" : [
              {
                "type" : "CIMSolidStroke",
                "enable" : true,
                "capStyle" : "Round",
                "joinStyle" : "Round",
                "lineStyle3D" : "Strip",
                "miterLimit" : 10,
                "width" : 2,
                "height3D" : 1,
                "anchor3D" : "Center",
                "color" : {
                  "type" : "CIMRGBColor",
                  "values" : [
                    76,
                    115,
                    0,
                    100
                  ]
                }
              },
              {
                "type" : "CIMSolidFill",
                "enable" : true,
                "color" : {
                  "type" : "CIMRGBColor",
                  "values" : [
                    112,
                    168,
                    0,
                    100
                  ]
                }
              }
            ],
            "angleAlignment" : "Map"
          }
        }
      }
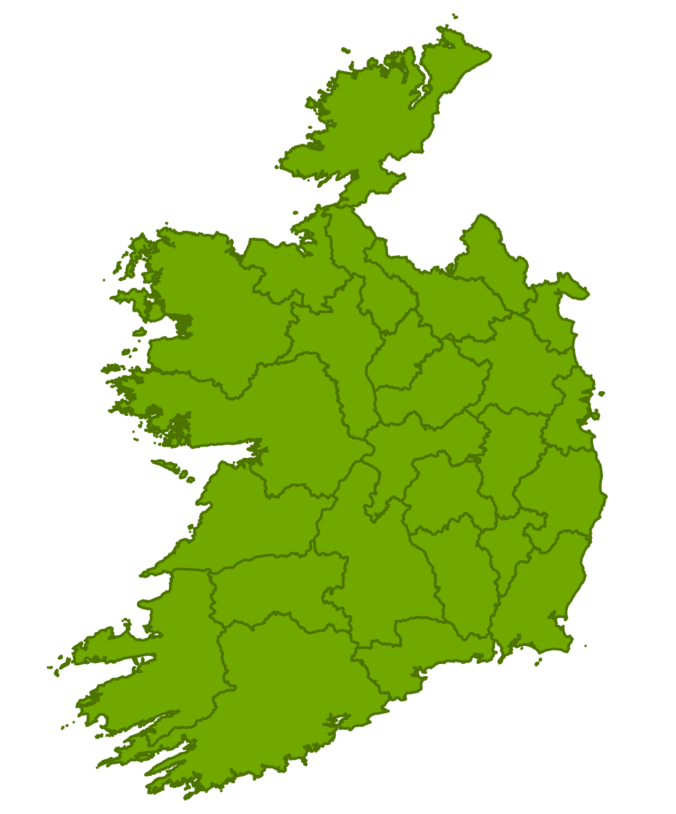
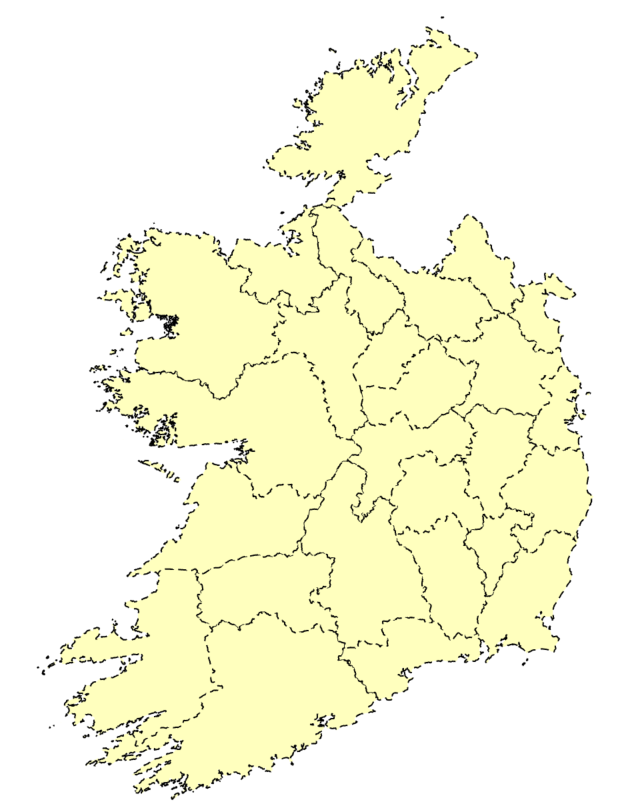
Alongside the CIMSolidStroke we have a property called width that controls the thickness of the outline of the polygon. Alongside each of the CIMSolidStroke and CIMSolidFill properties there is a property called color that defines the color of each part of the symbology. The color property contains a property called type defining the color model used, in this case it is RGB represented by a type value of CIMRGBColor, and values properties, in this instance is a list of integers defining RGBA. The County Boundary layer is currently displayed as per below which is represented in the above JSON defining the renderer.
Updating Symbology via the CIM definition with Python.
The previous Python code snippet showed us how to access the CIM via the getDefinition() function, we will pick up from there. For our first example, we are going to simply change the stroke and fill colors. We use the layer object setDefinition() to update the layer.
## use getDefinition to get the CIM
lyr_cim = lyr.getDefinition("V3")
## access symbolLayers property following the trail lyr_cim -> renderer -> symbol -> symbol -> symbolLayers
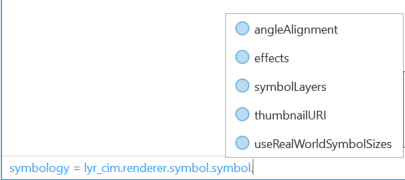
symbology = lyr_cim.renderer.symbol.symbol.symbolLayers
## access the stroke
stroke = symbology[0]
## update the width and RGB values, set the outline to black
stroke.width = 1
stroke.color.values = [0,0,0,100]
## access the fill
fill = symbology[1]
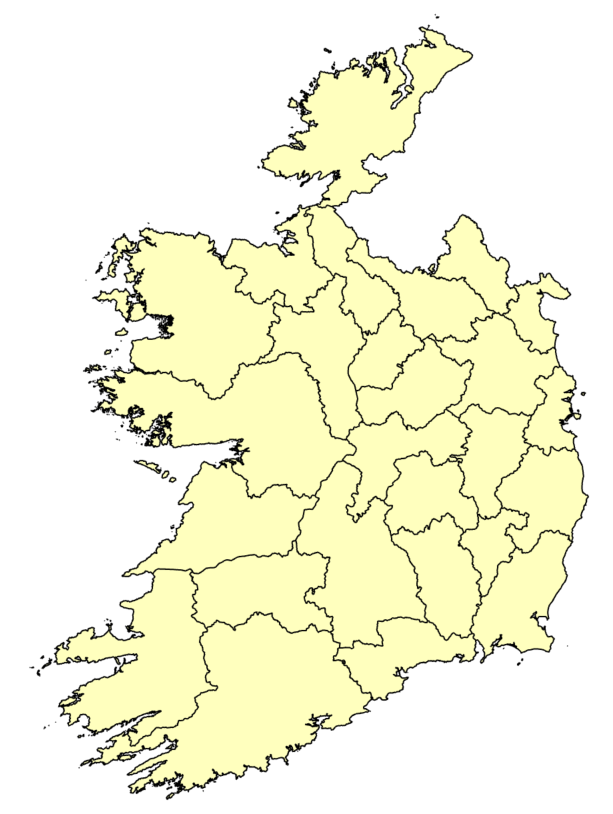
## update the fill color to pale yellow
fill.color.values = [255,255,190,100]
## set the definition
lyr.setDefinition(lyr_cim)
Let’s add a dash to our stroke. Check out some documentation here.
## add/update the effects property
stroke.effects = [
    {
        "type" : "CIMGeometricEffectDashes",
        "dashTemplate" : [5,5],
        "lineDashEnding" : "NoConstraint",
        "controlPointEnding" : "NoConstraint"
    }
]

## set the definition
lyr.setDefinition(lyr_cim)
Use autocomplete in ArcGIS Pro Python window to help navigate the definition.
The Python snippets in this example were performed within ArcGIS Pro using the Python window. Using the Python window in ArcGIS Pro is a great way to see how the definition is implemented using autocomplete. Below, we would select symbolLayers to access the symbology elements as a list.